Shopping Cart
0 item(s) - R0.00- 3D Printing and Plastic peripherals (8)
- 433Mhz and Lora (9)
- Support (1)
-
Amateur Radio (657)
- - Antenna Analyzer (12)
- - APRS (12)
- - ATU (5)
- - CW (1)
- - Digital Modes (9)
- - DMR (4)
- - Echolink (10)
- - Enclosure (14)
- - Eshail-2 (QO-100) (67)
- - GPS (9)
- - iGate (1)
- - Microcontrollers (43)
- - Microphone (1)
- - Power Supply (7)
- - Programming Cable (6)
- - QRP (9)
- - Radio interface (22)
- - Receiver (10)
- - Repeater (4)
- - RF Amplifiers (20)
- - RF Kits (19)
- - RF modules (116)
- - Rotator (1)
- - SDR (76)
- - Spectrum Analyzer (4)
- - SWR (9)
- - Transceiver (60)
- - WSPR (5)
- Antennas and Acc (321)
- Audio and Video (28)
- Bargain Box (1)
- Battery (3)
- Bluetooth (11)
- Cables (37)
- Computer Peripherals (104)
- Connectors (93)
- Data acquisition (1)
- Display (2)
- Electromechanical (25)
- Enclosure (13)
- GPS (7)
- Hardware (4)
- Home Automation (128)
- Inverter (9)
- Liquid (7)
- Lora (8)
- Microcontrollers (120)
- Modbus (3)
- MQTT (14)
- Network Radio (3)
- Networking (9)
- Power (133)
- Power supply (49)
- Radio Interface (17)
- RF Modules (142)
- ROIP (3)
- Satellite (94)
- Security (13)
- Sensor (17)
- Solar (14)
- Test and Measurements (66)
- Tools and Equipment (8)
- VOIP (11)
- Weather (1)
USB RF Power Meter V3.0 100K To 10GHZ -55 To +30dBm Prestored 9 Attenuation Curves 0.96" Color Display
Ex Tax: R1,348.00
Add to Compare
USB RF Power Meter V3.0 100K To 10GHZ -55 To +30dBm Prestored 9 Attenuation Curves 0.96" Color Display
Product Description:
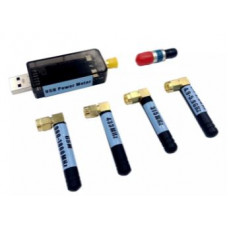
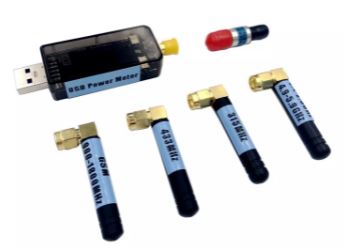
RF-Power-Meter-V3.0 series is a high-performance low-cost portable USB simple radio frequency power meter. With a 0.96 inch 160x80 pixel TFT full-color display, 5V power supply and data communication via USB. Easy to use, small size, convenient to carry, stable performance, high accuracy, preset offset, wide dynamic range, fast measurement speed. Software allows users to configure the power meter on a PC and makes data recording and sharing easy.
Features:
- Support sampling speeds 500uS (0.5mS), 200mS, 1S;
- With 30DB fixed attenuator and 4 common frequency band antennas;
- Maximum sample keeping function, better catch pulse signals;
- Maximum 9 frequency offset calibration data can be stored in advance;
- Host computer supports curve display, Chinese and English menus, and open serial port protocol;
- After parameter setting is completed, the host computer with TFT supports offline operation.
Product Applications:
- Calibration of radio frequency instruments;
- Testing and maintenance of radio frequency equipment;
- Measurement of standing wave ratio of radio frequency circuit (adding feedback bridge);
- Measurement of return loss of radio frequency circuit;
- Interference detection between wireless communication equipment;
- RSSI (received signal strength indicator) and transmission power level detection;
- Performance evaluation of step attenuator;
- Measurement of amplifier gain and network attenuation;
- Measurement of forward power and reflected power in directional coupler;
- Power measurement of GSM signal modulated by GMSK*.
Technical Parameters:
- Measuring power range: -55~+30 dBm (0 to -50dbm has a good linearity, and an attenuator is needed for more than 0DBM)
- Measurement power resolution: ±0.1 dBm
- Measuring frequency range: 100k~10GHz
- Input impedance: 50Ω
- Dynamic range: >60dB
- Working voltage: 5VDC (power supply via USB)
- Power display unit: dBm or W
- Body size: 55*24*14 mm (LxWxH); Size with USB protruding on the left and SMA protruding on the right: 79*24*14 mm (LxWxH)
Package Included:
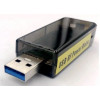
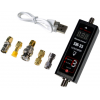
- 1 x USB Power Meter
- 1 x 6GHz/2W/30DB Attenuator
- 4 x Antennas (For GSM/WIFI/433/315MHz)
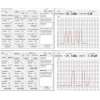
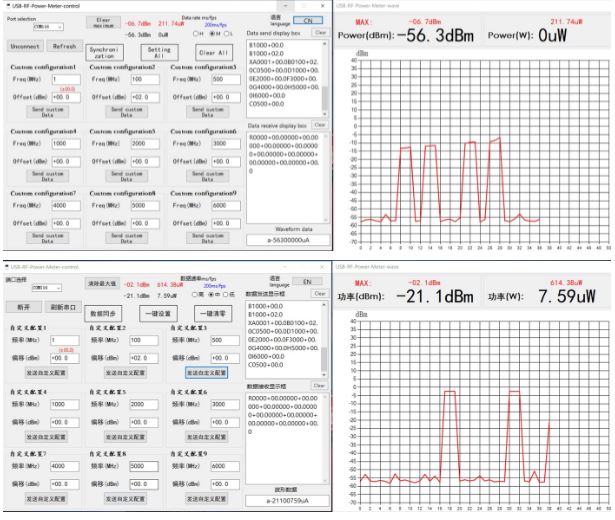
Screenshot of Attenuator Host Computer Software (The curves show the radio frequency signal that is being collected intermittently from a walkie-talkie):
Desktop Application can be downloaded from here
Common Sense of Radio Frequency:
dB is a pure counting unit:
For power, dB = 10*lg(A/B).
For voltage or current, dB = 20*lg(A/B).
dBm defines miliwatt. 0 dBm=1mw;
dBw defines watt. 0 dBw = 10lg1 w = 10lg1000 mw = 30 dBm.
By default, dB always defines power unit, which is calculated as 10lg. Of course, in some cases, signal strength (Amplitude) can be used to describe work and power. In this case, use 20lg as the meter. This applies to both the control field and the signal processing field. For example, sometimes you can see the expression of dBmV.
Interface Operation:
1. Interface display description:
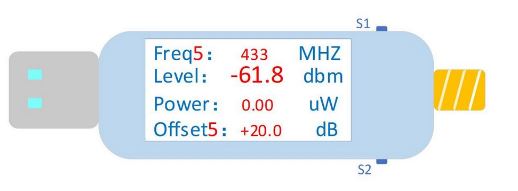
- FreqX: The frequency to be tested, the default is Freq0, and 8 groups of frequently used frequency points (Freq1-Freq8) can be stored, which can be set by pressing the key or supporting the upper computer.
- Level: The power value in dBm corresponding to the current frequency point.
- Power: The current frequency point corresponds to the power value in uW or mW as the unit.
- OffetX: Power correction value, the default is Offet0, and 8 sets of correction values corresponding to the frequency points (Offet1- Offet8) can be stored, which can be set by pressing the key or supporting the upper computer.
2. Brief description of interface operation:
There are two buttons on the power meter, which are defined as: facing the power meter, the upper button is S1 and the lower button is S2. Two are mainly for testing frequency setting and power correction value setting.
In test state, short press S1 and S2 buttons to switch between common frequency points and corresponding power correction values.
Long press S1 button for one second, release it to enter mobile adjustment interface. At this time, the interface data will stop detecting and the cursor stays at the position where it moved last time, and the default is the position with the highest frequency. At this time, short press S1 to move the cursor to the right and short press S2 to move the cursor to the left. When moving to the position that needs to be adjusted, press and hold S2 to enter adjustment mode. At this time, the number to be adjusted is displayed in yellow. Short press S1 to increase, short press S2 to decrease. After adjusting a certain digit, press and hold S2 to exit adjustment mode and return to the movement mode. Then repeat the above steps to adjust other numbers. After the digital adjustment is over, press and hold S1 to exit the mobile adjustment and enter measurement mode. Data is updated normally.
In normal mode, short press S1 and release it to select the measurement of commonly used frequency bands. Short press S2 to select the previous frequently used frequency band.
3. Detailed interface instructions:
The power meter has four working modes: normal measurement mode, fast switching mode, cursor moving mode, and numerical adjustment mode.
(1) Normal Measurement Mode:
In the normal measurement mode, the power meter displays power value in dBm and uW or mW corresponding to the current frequency point, as shown in the normal measurement mode in the picture below.
(2) Fast Switching Mode:
In the normal measurement mode, first, short press S1, and then release it to select the measurement of commonly used frequency bands, short press S2 and release it to select the last commonly used frequency band. The working status is shown in the picture below.
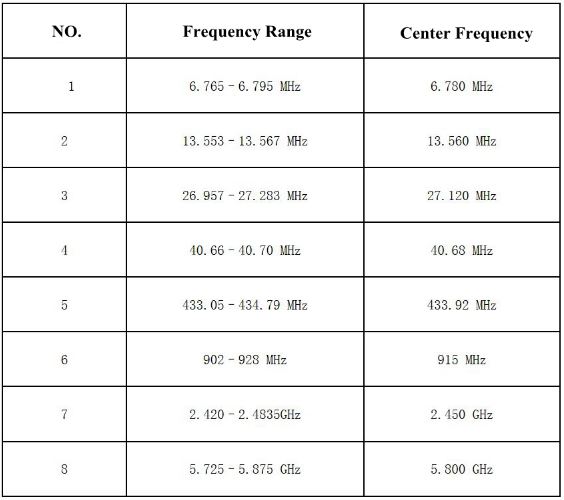
Common Frequency Band Table:
Taking into account that it may be necessary to measure signals with a larger power and the linearity of detection devices, a fixed attenuator is usually added before signal input terminal, and Offset0 is the power correction value to compensate for the attenuation of the signal by the attenuator.
For example, when adding a -20dBm attenuator to the input, you need to set Offset0 to +20dBm. At this time, the displayed power value is the power value of the input signal plus 20dBm to display the power value of the original signal to compensate for the attenuator impact.
(3) Cursor Moving Mode:
When starting to set test frequency, press and hold S1 for two seconds, after releasing it, it will enter moving mode. As shown in the figure, the cursor stays at the highest position of the value in the row of Frequ. Short press S1 and S2 to move the cursor left and right.
(4) Numerical Adjustment Mode:
After moving to the position to be adjusted, press and hold S2 for two seconds. After releasing it, it enters the numerical adjustment mode, and the number turns yellow, as shown in the figure.
Short press S1 and S2 to increase or decrease the value of this digit, among which the frequency adjustment range is 0-10000Mhz. After adjusting to the frequency you want to measure, long press S2 to return to the cursor movement mode, as shown in Figure 3a (after long press S2 and release).
The same procedure can be used to adjust power correction value Offset0. After the adjustment, long press S1 to exit the mobile mode and return to the normal measurement mode, as shown in Figure 3b (after long press S1 to release).
After returning to the normal measurement mode, data will be updated normally.
Desktop Application can be downloaded from here
Write a review
Your Name:Your Review: Note: HTML is not translated!
Rating: Bad Good
Enter the code in the box below:
Giga Technology © 2025

